I had the opportunity to research for a client of mine the Azure performance when running functions triggered from the Azure Service Bus as well as Azure Durable functions.
This article describes this experience, presents the important details you need to consider to achieve the performance and scalability for running the Azure functions in the Cloud, the tools used to understand and measure the process and provides a number of test cases running various configuration and their results that can be used as a baseline for your own work.
The details from below are useful knowledge that will contribute to an easier understanding of the topics presented in this article.
Consumption plan vs. dedicated plan
Azure Functions comes in two main flavors, consumption and dedicated.
The consumption plan is our “serverless” model, your code reacts to events, effectively scales out to meet whatever load you’re seeing, scales down when code isn’t running, and you’re billed only for what you use.
The dedicated plan on the other hand, involves renting control of a virtual machine. This control means you can do whatever you like on that machine.
It’s always available and might make more sense financially if you have a function which needs to run 24/7.
What is cold start?
Broadly speaking, cold start is a term used to describe the phenomenon that applications which haven’t been used take longer to start up.
In the context of Azure Functions, latency is the total time a user must wait for their function. From when an event happens to start up a function until that function completes responding to the event.
So more precisely, a cold start is an increase in latency for Functions which haven’t been called recently.
When using Azure Functions in the dedicated plan, the Functions host is always running, which means that cold start isn’t really an issue.
Azure Well-Architected Framework guiding tenets
The real power of the Cloud is the ability to scale out/in the number of running instances processing the work based on the workload requested.
The applications deployed into the Cloud needs to be designed to achieve this scalability.
Two main ways an application can scale include vertical scaling and horizontal scaling.
Vertical scaling (scaling up) increases the capacity of a resource, for example, by using a larger virtual machine (VM) size.
Horizontal scaling (scaling out) adds new instances of a resource, such as VMs or database replicas.
Horizontal scaling has significant advantages over vertical scaling, as you can read in this link.
Horizontal scaling allows for elasticity. Instances are added (scale-out) or removed (scale-in) in response to changes in load.
Scaling out/ in for Azure Service Bus triggered functions
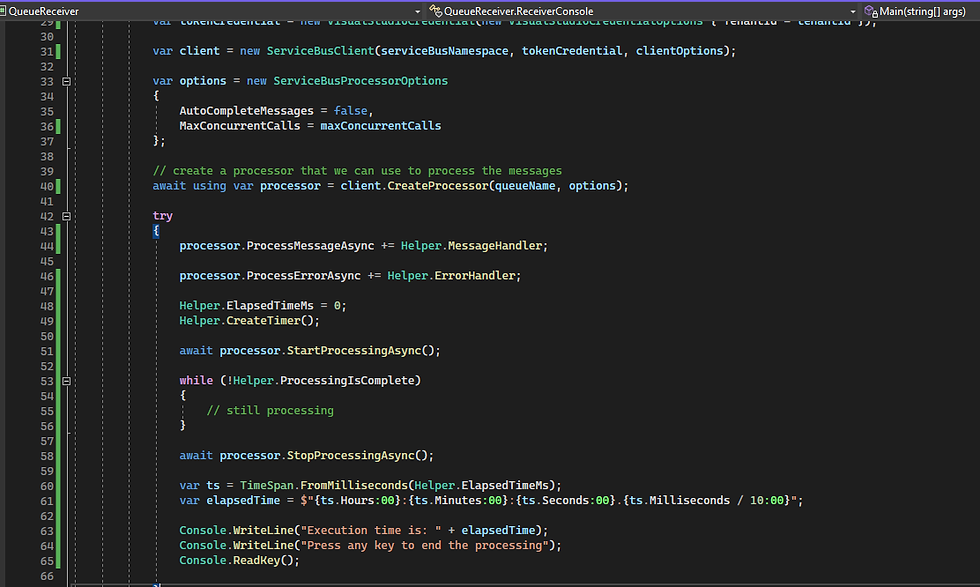
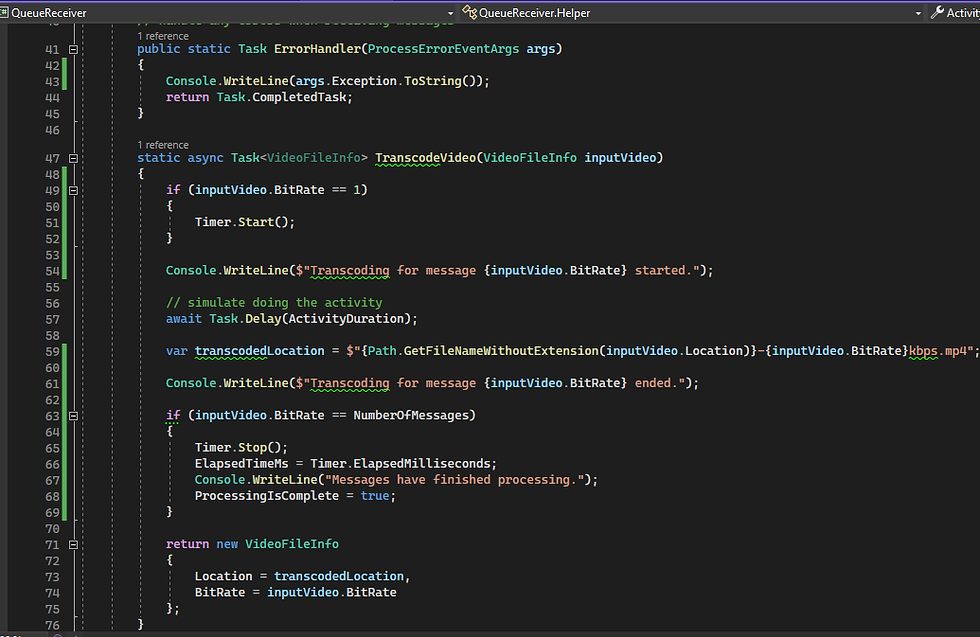
I have created 2 console applications (QueueSender and QueueReceiver) to send and process a configurable number of messages into the Service Bus.
Each Service Bus message triggers the execution of a function that simulate a processing operation by adding a few seconds delay into the code.
The QueueReceiver console application displays the time it took for the whole process execution.
I have performed the testing using up to 4000 messages posted at once into the queue, and I have used a function's execution duration as 5s, 10s, 20s, 30 seconds.

Each service bus message triggers a function's execution

Processing the messages from the Service Bus queue

Processing function

In the above image, you can see the result of a test processing 4000 messages with an activity duration of 30 seconds per function's execution where the number of concurrent instances has been set to 4000.
The overall processing time is 34 seconds, a duration that is slightly bigger than a single function's execution time.
For a similar test processing of 4000 messages with a 30 seconds duration per function's execution, I have changed the number of concurrent instances to 100.
The overall execution time duration is: 00:20:22.29, which is approximately 40 times slower than the first execution's time.
Azure durable functions
How do they work?
Each Azure Durable function it is linked with an Azure Storage Provider associated with its task hub.
The Azure Storage provider represents the task hub in storage using the following components:
Two Azure Tables store the instance states.
One Azure Queue stores the activity messages.
One or more Azure Queues store the instance messages. Each of these so-called control queues represents a partition that is assigned a subset of all instance messages, based on the hash of the instance ID.
A few extra blob containers used for lease blobs and/or large messages.

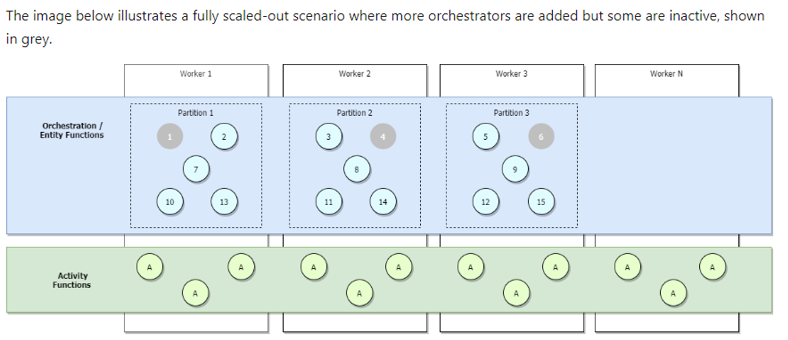
The controls queues are used to trigger the orchestrator and entity functions .
The work-item queue is used to trigger the activity functions.
There is a single work-item queue but several control queues based on the number of partitions configured in the host.json file: from 4 to 16.

If you're running on the Azure Functions Consumption or Elastic Premium plans, or if you have load-based auto-scaling configured, more workers will get allocated as traffic increases and partitions will eventually load balance across all workers.
If we continue to scale out, eventually each partition will eventually be managed by a single worker.
Activities, on the other hand, will continue to be load-balanced across all workers. This is shown in the image below.

Performance targets for the Consumption Plan:


Test setup
To test the performance and scalability for the Azure Durable functions I have created a project where I am triggering the execution of an orchestrator function over an HTTP call.
The function spawned a number of activities and this number is configurable inside the project.
I have created a Postman script that allows me to call any number of functions I want to process at a given time.
Similar with the example from above, each activity can take a configurable duration.

The test is measuring the performance of Azure Durable functions execution for 2 situations:
a big number of functions calls and a small number of activities
a small number of function calls but with a large number of activities per function.
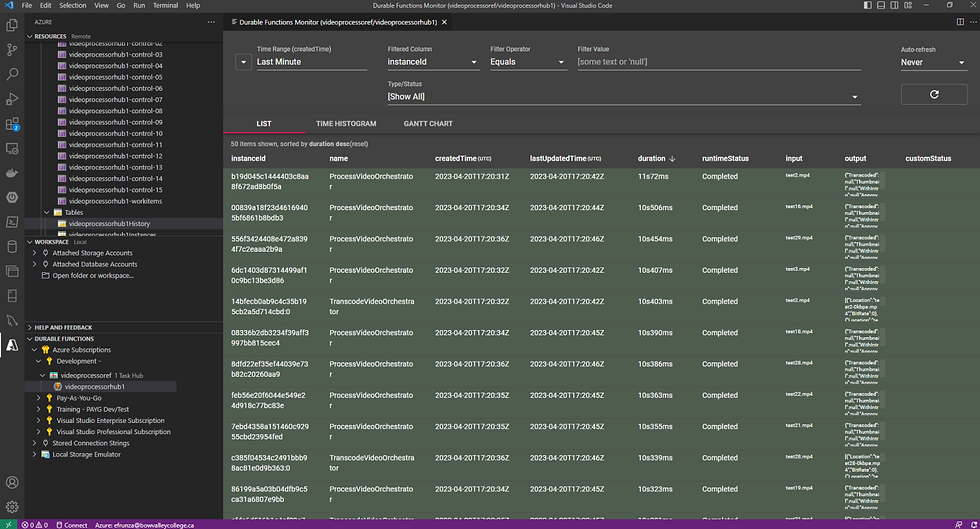
To understand better the execution details for the Azure durable functions I have installed the Azure Durable Functions Monitor, see the link from below:
https://github.com/scale-tone/DurableFunctionsMonitor#durable-functions-monitor
The monitor can be opened in VS Code and you can see the functions instances and activities executed in the TaskHub you are connected to:


Azure Durable Functions configuration

To be continued...

Comments